WASP3D’s Real-time Business graphics workflow offers broadcasters sophisticated tools to synchronize large amounts of financial data into dynamic and engaging visual information in real-time. The Business Graphics Broadcast Services intelligent workflow helps users to create and playout graphics that respond to real-time data updates & live feeds from third-party business data providers, be it single or multiple wire-feeds (Money line, Reuters, local newswires, etc.), as well as social media feeds.
“FinWiz”, the feed handler module of the WASP3D Business graphics workflow communicates with most wire-feeds to extract the latest data – and make it available for instantaneous on-air playout. FinWiz supports on-air real-time updates at the press of a button, even with graphics already on-air.
Wire Services
Live information and updates for Stock graphics or any other graphics for business broadcast from sources such as Money line, Telerate, Reuters and Bloomberg, etc. are captured through the Wire Services function.
Feed handler
This function maintains the connectivity of server applications with the wire services. Additionally, it initiates applications for handling transactional and historical data.
Database Server
This function initiates, monitors, controls and executes the transactions that process queries, collect and collate data, to feed the output source with the relevant information.
Rundown Playlist Controller
Collates data manages the playlist and presents all Business graphics it in a predetermined fashion.
MOS Complaint Query Software
Query Generation System is used for displaying an array of information such as Simple Moving Average, Exponential Moving Average, Relative Strength Index, Percentage Gainers, Percentage Losers, Top Trades, Indices & Forex etc.
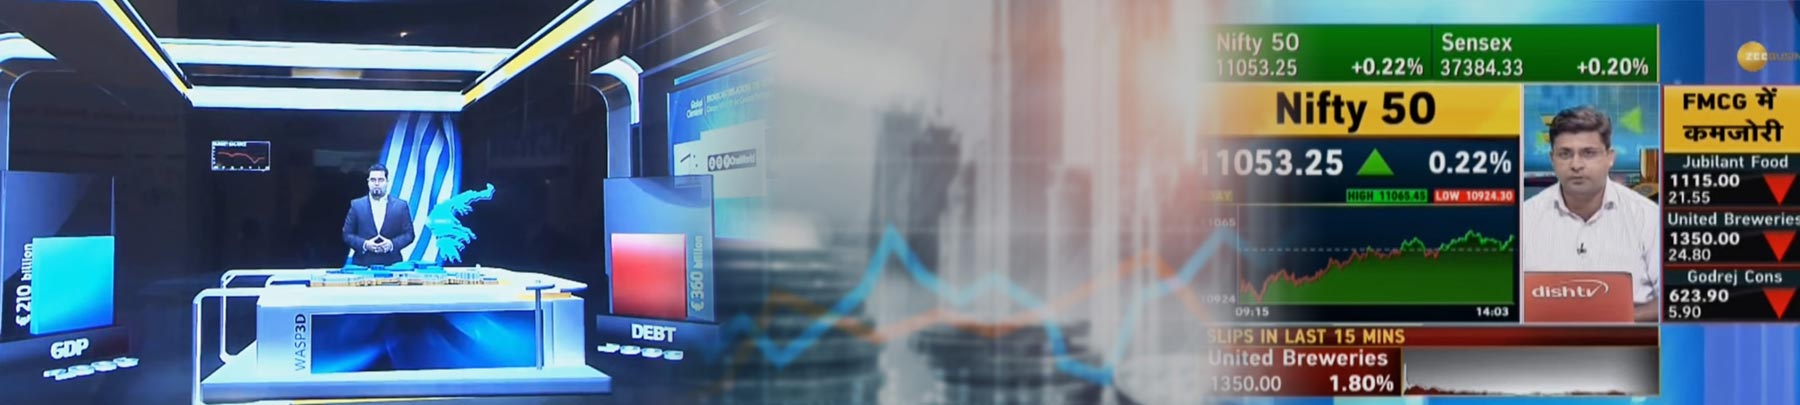
Zee Business, India uses WASP3D Business Graphics Broadcast Services to cater to all its custom business graphic template requirements


